
Information about the Activities of Women
(April 2026)
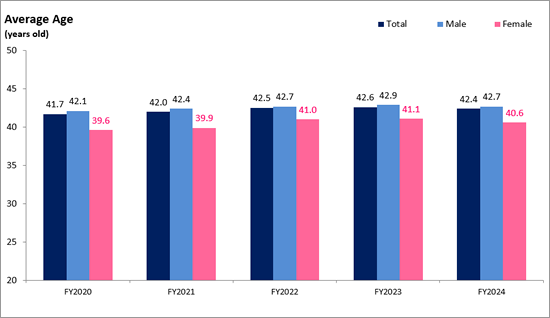
Average Age
| Fiscal Year | Total | Male | Female |
|---|---|---|---|
| FY2022 | 42.5 | 42.7 | 41.0 |
| FY2023 | 42.6 | 42.9 | 41.1 |
| FY2024 | 42.4 | 42.7 | 40.6 |
| FY2025 | 42.2 | 42.5 | 40.7 |
| FY2026 | 41.9 | 42.1 | 41.0 |
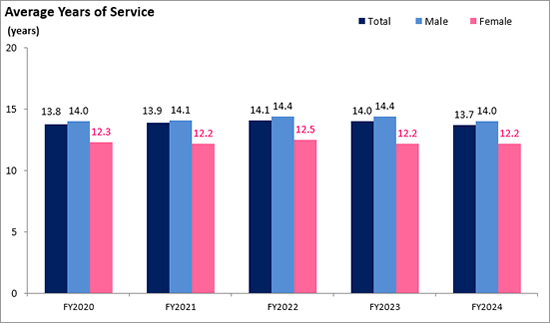
Average Years of Service
| Fiscal Year | Total | Male | Female |
|---|---|---|---|
| FY2022 | 14.1 | 14.4 | 12.5 |
| FY2023 | 14.0 | 14.4 | 12.2 |
| FY2024 | 13.7 | 14.0 | 12.2 |
| FY2025 | 13.3 | 13.5 | 11.9 |
| FY2026 | 12.7 | 12.8 | 12.0 |
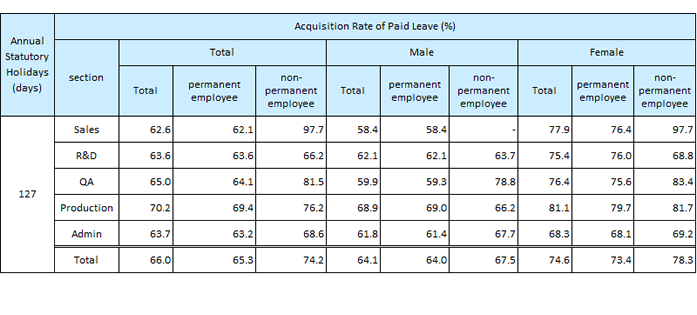
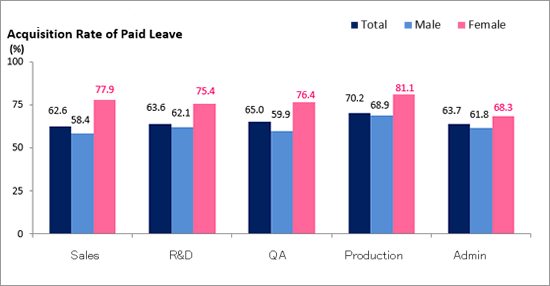
Statutory Holidays & Acquisition Rate of Paid Leave
FY2026
* Click to enlarge
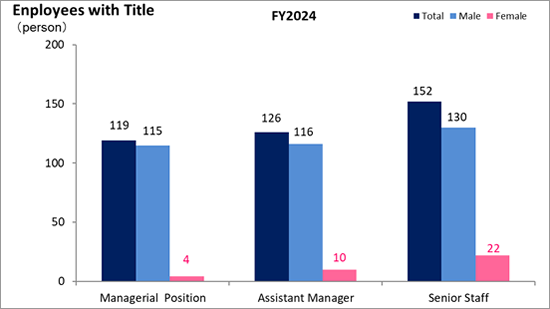
Ratio of Women Employees among its Managerial Positions
FY2022~FY2026
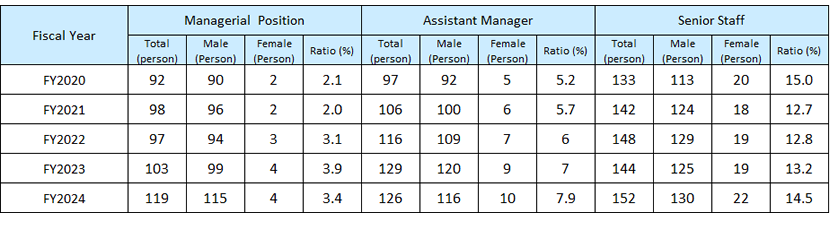
* Click to enlarge
Childcare Leave Rate
| Fiscal Year | Male | Female |
|---|---|---|
| FY2022 | 23.5 | 100.0 |
| FY2023 | 29.5 | 100.0 |
| FY2024 | 46.6 | 100.0 |
| FY2025 | 57.7 | 100.0 |
| FY2026 | 72.5 | 100.0 |
Gender Pay Gap
Gender Pay Gap
| All Workers | Full-time Workers | Part-time Workers |
|---|---|---|
| 69.2 | 81.3 | 65.9 |
(1)Full-time Workers
| Position | Male | Female | Wage Differentials | |
|---|---|---|---|---|
| Managerial Position | Deputy General Manager and above | 5.8 | 0 | - |
| Section Manager | 11.2 | 3.1 | 102.9 | |
| Supervisors | Assistant Manager | 17.0 | 11.5 | 97.5 |
| Senior Staff | 17.2 | 16.9 | 97.5 | |
| Subtotal (Total of Managerial and Supervisory Positions) | 51.2 | 31.5 | ||
| General staff | 48.8 | 68.5 | 90.4 | |
| Total of Full-time Workers | 81.3 | |||
(2) Part-time Workers
| Employment | Male | Female | Wage Differentials |
|---|---|---|---|
| Re-Employment | 10.6 | 0 | - |
| Part-time Employee | 43.4 | 75.9 | 84.0 |
| Contract Employee (Full-time) | 38.7 | 17.9 | 80.1 |
| Contract Employee (Part-time) | 7.3 | 6.2 | 85.9 |
| Total of Part-time Workers | 65.9 | ||